How to have a meaningful conversation about sex in one easy chart

Talking about sex can be hard, especially in a society that still deems it taboo far too often, but when it comes to having satisfying and consensual sex, we’ve all heard that ‘communication is key’ plenty of times.
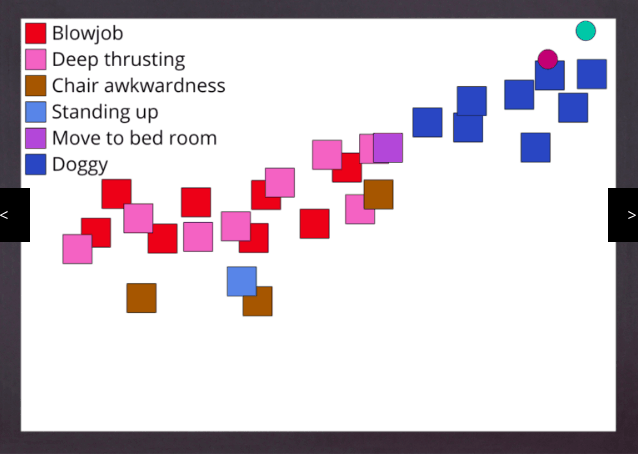
Cue, The Graphic Sex Project (GSP), an interactive visual chart built to display your sexual preferences in a way that makes it simple to start a conversation – particularly if you find the words hard to find.
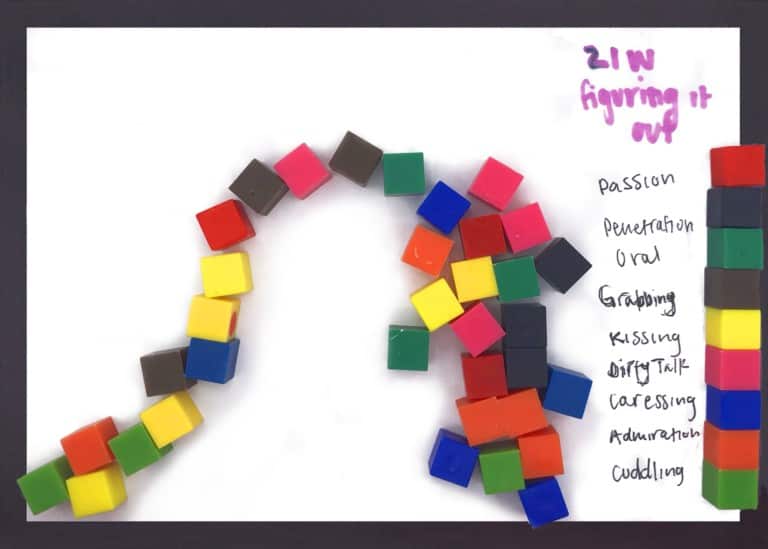
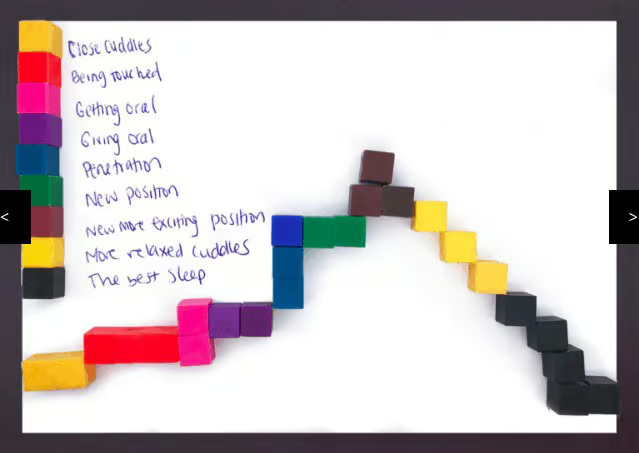
While now a Web app, the GSP began as a simple interactive art exercise and workshop, using just paper and blocks. Now, GSP CEO Jennifer Beman describes it as “a powerful tool to help people think about sex from a totally new perspective” that’s accessible to anyone, at any time.
Beman also tells SEXTECHGUIDE that there are plans to develop a user-friendly, app-based version – and more tech-based interfaces for the live installations.
By opening up meaningful conversations around sex, the graphs help to grow intimacy between partners, and overcome societal stigma around the taboos of sex.
How does it work?
On the digital version, there are multiple graph titles to choose from to create a simple representation of your sexual preferences. You just need to pick a color, and assign it to any sexual experience or preference, such as:
Circumvent Big Tech's Censorship! Never miss another post!
Subscribe to our notifications!
Article continues below
- A typical sexual encounter you like
- A typical sexual encounter you don’t like
- How you like to have sex
- How you don’t like to have sex
- Most recent sexual encounter
- One specific good sexual experience
- Once specific bad sexual experience
- An aspect of your sexual life
- Fantasy
- Other

Bringing couples closer together
For couples, it essentially works by each creating a graph, sharing them, and then describing each other’s graphs. You can then compare how they are the same, or different – such as the words used to describe an activity and the duration of an activity. From there, you can then discuss what you enjoy or dislike in your partner’s graph.
Sex can be such a sensitive issue for some couples, particularly if you’ve been together for some time and want to try something new, or perhaps stop doing something you do regularly. What if you offend your partner about their technique? What if they don’t like what you like?
GSP suggests trying not to get defensive as everyone has different preferences. “Talk about what works for you and what doesn’t,” Beman says.
There are unique qualities that using a chart helps you unlock. For example, the graph allows you to easily gauge the length of time you both like to engage in sexual activities (this could range from a quicky to a sex marathon). There are also markers to indicate climaxes, and the words you choose to describe similar activities can help you vocalize your needs during sex, as well as becoming more in-tune to each other’s sexual preferences.
Then you can also think about what you’d like to add, browse the other graphs for inspiration and make a new ‘fantasy’ graph together.

Overcoming sexual stigma
What GSP inadvertently does, as a result of the live and digital charts, is host a plethora of anonymous sexual data. Beman says she’d love to collaborate with sex researchers to crunch all this data. Where you can filter by demographic, you can also browse into the hidden world of people’s desires versus their realities.
Opening up meaningful, honest conversations around sex allows us to take a peek into the bedrooms of the world. The more we understand the diversity of desire, the more normalized and less shameful it can be to talk about sex.
Beman contemplates just how wonderful it would be to see “people including their graphs on their dating app profiles.” Wouldn’t sex be so much better from the off? Or maybe it would ruin the mystery entirely. Either way, talking about it would become a whole lot easier.
Read Next: 7 Best Sex-Ed Apps for Android and iPhone


